

More than 1 in 4 American paychecks is swallowed up by car ownership, being “car poor.” Between gas, insurance, and repairs, the true cost of owning a vehicle adds up to far more than the sticker price.
Like homeownership, car ownership costs much more than just the original purchase price of the vehicle.
You have to factor in gas, maintenance, and any upgrades you decide to make. In these unpredictable times, it’s worth asking if you can afford to own a car.
Realistically, it comes down to what portion of your income you’ll spend on transportation. That’s your car ownership to income ratio.
To gather this data for you, we looked to three reputable sources: AAA’s “Your Driving Costs” article, MoneyGeek’s breakdown of car ownership costs, and BankRate’s study on the hidden costs of owning a car.
Key Takeaways
- Affordability varies widely by region: Northeastern and Western states tend to have higher car ownership costs relative to income, while Southern and some Midwestern states are generally more affordable. Urban access to public transit can offset high vehicle costs in expensive regions.
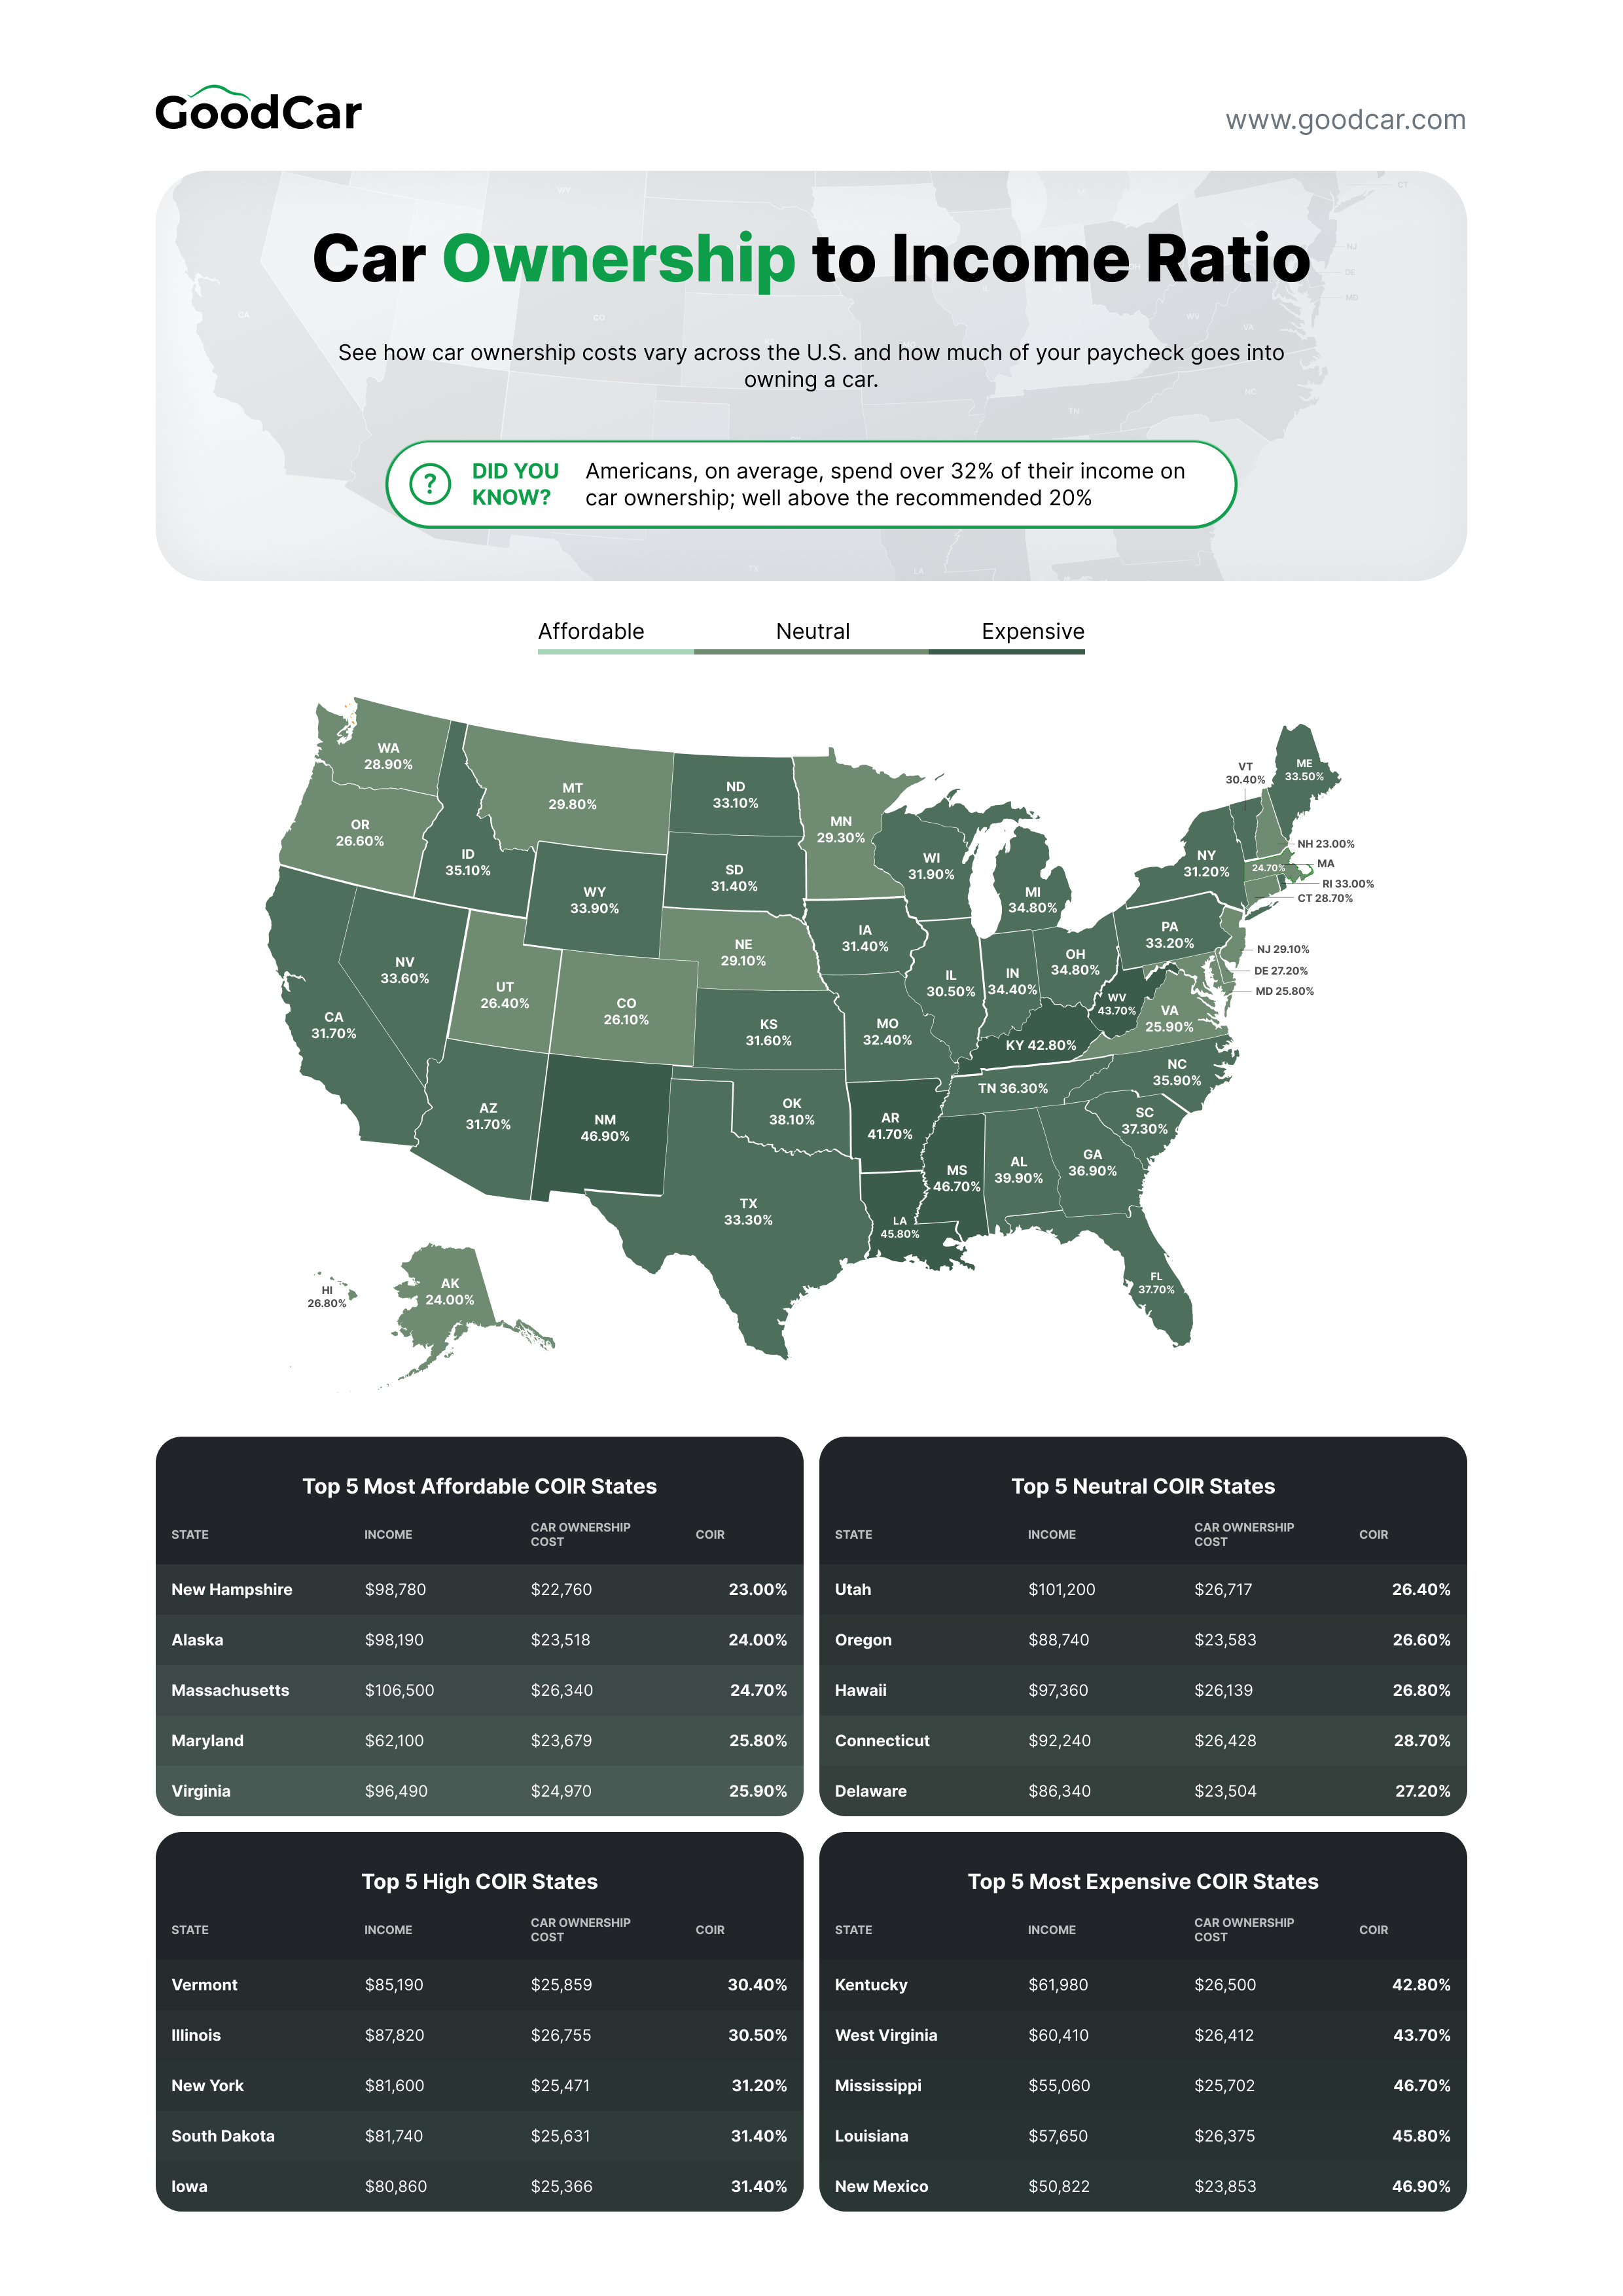
- Many Americans exceed the recommended 20% threshold: Across the U.S., the average car ownership to income ratio is over 32%. This means most households spend more than the suggested 15–20% of take-home pay on vehicle expenses. This can strain budgets and limit financial flexibility.
- Household context matters: Single-earner households, long commutes, and rural locations can make high COIR ratios more burdensome. Dual-income households or urban residents with access to alternative transportation may better absorb higher car costs.
Understanding the Car Ownership to Income Ratio
The car ownership to income ratio is how much all of your car expenses are divided by your individual or household income.
While the car ownership to income ratio (COIR) does give you a clear picture of affordability, that’s not the only factor. Make sure you consider the nuances behind the numbers.
Michael Kruse, a DUI and Criminal Defense Lawyer and the Head of Kruse Law Firm says:
“COIR is supposed to bend with life stage, income stability, and location since each of these influences the financial burden of owning a car.
A person at the beginning of his/her professional activity with few savings can use more funds to cover financing and increasing insurance rates, and it becomes much more disruptive when there are some sudden repairs or job loss.
Someone later in the career may purchase a $25,000 car in cash or with a large down payment, whereas an early-career employee may also purchase a used car at a price that is worth $15,000 that will be passed on with a higher-interest loan, which will cost the worker hundreds of dollars in interest over a loan period.
These gaps are enhanced by location. City motorists may spend close to $300 monthly on parking and more than $2,000 annually on insurance. In contrast, inland drivers may not spend on parking charges, but save thousands annually on gasoline due to long commutes.”
On top of that, household income is usually shared among multiple earners. This means transportation decisions can vary significantly depending on family size, commuting needs, and lifestyle choices.
For example, a dual-income household may afford a higher COIR without as much financial strain. At the same time, an average-income single-earner household might find it to be much less affordable or difficult to afford a vehicle.
Second, car ownership costs can fluctuate by both state and region. Urban residents might spend less on gas if public transit is available. Plus, insurance and parking fees are usually higher.
In contrast, rural households typically have lower insurance rates but higher fuel costs. This distinction is due to those long commutes.
Third, maintenance and unexpected repairs can eat away at your budget super fast. So make sure you build a contingency fund within your COIR calculation.
COIR should guide you to determine how much you should spend on vehicle expenses. It’s up to you to sit down and analyze your household’s total income and commuting patterns. You’ll also want to look at your lifestyle priorities. From there, you can make informed choices that balance affordability and convenience.
As a general rule, you should not spend more than 15-20% of your take-home pay on your car expenses. That means that your COIR should be under 0.2.
This approach will help you make sure that your car ownership remains sustainable and you won’t be compromising other necessary expenses.
Car Ownership to Income Ratio: At a Glance
Below, you’ll find the top five states in each region with the highest and lowest ratios, with each state’s average after-tax salary, annual car ownership cost, and car ownership to income ratio (COIR).
Northeast States
The Northeast tends to have higher household incomes and higher car ownership costs. But residents often live in urban areas with alternative transportation. This can offset vehicle expenses.
Highest Ratios (least affordable):
- Maine
Income: $75,740
Cost: $25,401
COIR: 33.5%
- Pennsylvania
Income: $79,820
Cost: $26,527
COIR: 33.2%
Lowest Ratios (most affordable):
- New Hampshire
Income: $98,780
Cost: $22,760
COIR: 23.0%
- Massachusetts
Income: $106,500
Cost: $26,340
COIR: 24.7%
- Connecticut
Income: $92,240
Cost: $26,428
COIR: 28.7%
Southern States
The South generally has lower household incomes than the Northeast but also lower car ownership costs. This makes car ownership more affordable.
Highest Ratios (least affordable):
- Mississippi
Income: $55,060
Cost: $25,702
COIR: 46.7%
- Louisiana
Income: $57,650
Cost: $26,375
COIR: 45.8%
Lowest Ratios (most affordable):
- Virginia
Income: $96,490
Cost: $24,970
COIR: 25.9%
- Delaware
Income: $86,340
Cost: $23,504
COIR: 27.2%
- Texas
Income: $79,060
Cost: $26,343
COIR: 33.3%
Midwest States
The Midwest offers a mix of moderate household incomes and relatively low car costs. Many residents rely on cars for commuting across longer distances. But overall, affordability is fair.
Highest Ratios (least affordable):
- Michigan
Income: $76,960
Cost: $26,786
COIR: 34.8%
- Ohio
Income: $73,770
Cost: $25,665
COIR: 34.8%
Lowest Ratios (most affordable):
- Minnesota
Income: $90,340
Cost: $26,484
COIR: 29.3%
- Nebraska
Income: $89,190
Cost: $25,927
COIR: 29.1%
- Illinois
Income: $87,820
Cost: $26,755
COIR: 30.5%
Western States
Western states often have higher household incomes and higher vehicle costs, especially in urban areas like California and Washington.
Highest Ratios (least affordable):
- Idaho
Income: $73,910
Cost: $25,910
COIR: 35.1%
- Wyoming
Income: $77,200
Cost: $26,197
COIR: 33.9%
Lowest Ratios (most affordable):
- Alaska
Income: $98,190
Cost: $23,518
COIR: 24.0%
- Colorado
Income: $96,640
Cost: $25,239
COIR: 26.1%
- Utah
Income: $101,200
Cost: $26,717
COIR: 26.4%
Car Ownership to Income Ratios by State
For a more comprehensive look at the country’s car ownership to income ratio by state, here’s a complete breakdown.
| Region | State | Income | Car Ownership Cost | COIR (%) |
|---|---|---|---|---|
| Northeast | Connecticut | $92,240 | $26,428 | 28.7% |
| Northeast | Maine | $75,740 | $25,401 | 33.5% |
| Northeast | Massachusetts | $106,500 | $26,340 | 24.7% |
| Northeast | New Hampshire | $98,780 | $22,760 | 23.0% |
| Northeast | New Jersey | $91,590 | $26,642 | 29.1% |
| Northeast | New York | $81,600 | $25,471 | 31.2% |
| Northeast | Pennsylvania | $79,820 | $26,527 | 33.2% |
| Northeast | Rhode Island | $81,860 | $26,982 | 33.0% |
| Northeast | Vermont | $85,190 | $25,859 | 30.4% |
| South | Alabama | $60,660 | $24,190 | 39.9% |
| South | Arkansas | $63,250 | $26,379 | 41.7% |
| South | Delaware | $86,340 | $23,504 | 27.2% |
| South | Florida | $72,200 | $27,235 | 37.7% |
| South | Georgia | $72,420 | $26,691 | 36.9% |
| South | Kentucky | $61,980 | $26,500 | 42.8% |
| South | Louisiana | $57,650 | $26,375 | 45.8% |
| South | Mississippi | $55,060 | $25,702 | 46.7% |
| South | North Carolina | $68,610 | $24,651 | 35.9% |
| South | South Carolina | $69,100 | $25,802 | 37.3% |
| South | Tennessee | $72,700 | $26,392 | 36.3% |
| South | Texas | $79,060 | $26,343 | 33.3% |
| South | Virginia | $96,490 | $24,970 | 25.9% |
| South | West Virginia | $60,410 | $26,412 | 43.7% |
| Midwest | Illinois | $87,820 | $26,755 | 30.5% |
| Midwest | Indiana | $76,910 | $26,430 | 34.4% |
| Midwest | Iowa | $80,860 | $25,366 | 31.4% |
| Midwest | Kansas | $84,830 | $26,840 | 31.6% |
| Midwest | Michigan | $76,960 | $26,786 | 34.8% |
| Midwest | Minnesota | $90,340 | $26,484 | 29.3% |
| Midwest | Missouri | $78,290 | $25,340 | 32.4% |
| Midwest | Nebraska | $89,190 | $25,927 | 29.1% |
| Midwest | North Dakota | $76,960 | $25,504 | 33.1% |
| Midwest | Ohio | $73,770 | $25,665 | 34.8% |
| Midwest | South Dakota | $81,740 | $25,631 | 31.4% |
| Midwest | Wisconsin | $79,690 | $25,426 | 31.9% |
| West | Alaska | $98,190 | $23,518 | 24.0% |
| West | Arizona | $82,660 | $26,201 | 31.7% |
| West | California | $89,870 | $28,504 | 31.7% |
| West | Colorado | $96,640 | $25,239 | 26.1% |
| West | Hawaii | $97,360 | $26,139 | 26.8% |
| West | Idaho | $73,910 | $25,910 | 35.1% |
| West | Montana | $79,220 | $23,624 | 29.8% |
| West | Nevada | $81,310 | $27,357 | 33.6% |
| West | Oregon | $88,740 | $23,583 | 26.6% |
| West | Utah | $101,200 | $26,717 | 26.4% |
| West | Washington | $93,440 | $27,016 | 28.9% |
| West | Wyoming | $77,200 | $26,197 | 33.9% |
National Car Ownership to Income Ratio
To put things into perspective, the average annual household income in the U.S. is $80,610. 20% of that figure is $16,122.
Divide that figure by 12 months, and you have $1343.5 per month. That would be your entire vehicle budget for the month.
Across the U.S., car owners spend an average of:
- $266 per month on gas ($3201/yr)
- $121 per month on maintenance ($1452)
- $220 per month on insurance (for full-coverage)
After those deductions, you’re left with $736.5.
So, if your household income is around the national average, you should not have a car payment of more than $736.5 per month if you own one car.
National Averages
- Average Household Income: $80,610
- Average Annual Car Ownership Cost: $25,866 a year or about $2,155.5 a month (data above averaged)
- National Ownership to Income Ratio: 32.08%
As you can see, most Americans spend well over the recommended 20%, likely because of factors like inflation and wages not meeting the cost of living in the United States.
Of course, if you own your car outright, your ownership expenses will be much lower than if you have a loan. This is especially true because the interest rate for a car averages 9-14%, depending on whether it’s new or used. That’s a lot of extra money to pay for interest.
Your car affordability based on household income should be the price of the car and its needs, not the interest spread out over 10 years.
To figure out what your car ownership to household income ratio should be, just take your monthly household income and multiply it by 0.20. That will tell you how much car you can afford on a car.
Don’t forget to factor in fuel, insurance, and maintenance. You can use the figure above to help you come up with your total.